
MLOps Case Study
Project Home: Customer-Churn-Prediction
Churn Prediction
Most churn prediction tutorials stop at a Jupyter notebook and a confusion matrix. Customer-Churn-Prediction takes the opposite approach: it treats churn modeling as an excuse to wire up a full MLOps stack — versioned data, reproducible hyperparameter search, experiment tracking, and observability — all orchestrated through Docker Compose. Here’s a walkthrough of how the pieces fit together and why each one is there.
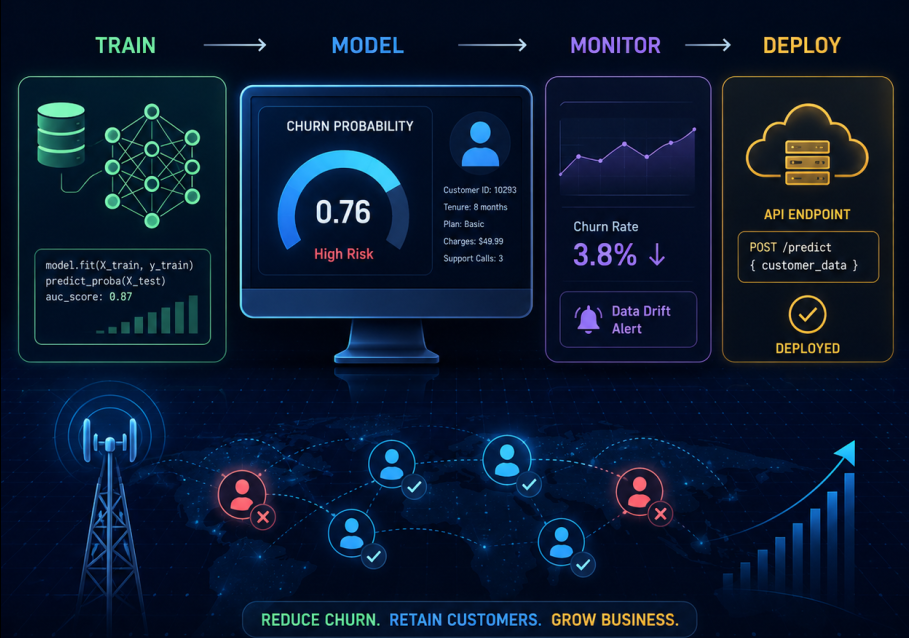
Problem Statement
Don’t use AI without knowing context 📝֎🧠
It’s easy to see every problem as an opportunity to use AI. Instead, let’s start with the problem statement and determine whether AI is the right tool.

Let’s Discuss the problem cycle before we jump into tools, solving technology is also good problem.
Every Industrial problems should be evaluated from multiple feasibility perspectives before development begins.
- Technical feasibility - assesses whether sufficient, high-quality data and appropriate tools are available or what tools needs to be useful.
- Economic feasibility determines whether the expected business benefits, such as reduced customer loss and increased retention.
- Operational feasibility evaluates whether the organization can effectively use
- Auditing & Governance feasibility focuses on establishing clear policies for data ownership, data sources, fairness and compliance thoughout it’s lifecycle
Business Phase
Know your KPI, Know your Data
| KPI | What it Measures | Why it Matters |
|---|---|---|
| Gross Customer Churn Rate | Percentage of customers who leave during a given period. | Measures overall customer loss and retention performance. |
| Net Customer Churn Rate | Difference between new customer acquisitions and customer cancellations. | Indicates whether the customer base is growing or shrinking. |
| Daily Active Users (DAU) | Number of customers actively using the product each day. | Declining DAU can signal poor customer experience or potential churn. |
| Weekly/Monthly Active Users (WAU/MAU) | Number of customers active each week or month. | Measures long-term engagement and product adoption. |
Data Phase
Sometime we may loss into complex understanding and data maturity, it may grow as
- Business Domain and Requirements Discovery – Understanding the business problem, objectives, stakeholders, and success criteria.
- ETL Project – Collecting, cleaning, integrating, and preparing data from multiple sources or formulating implementation of the new workflow.(step 6)
- Data Engineering and Data Wrangling Project – Building reliable data pipelines, transforming raw data, and ensuring data quality. In many organizations, this effort takes significantly more time than developing the machine learning model itself.
- Feature Engineering Project – Creating meaningful features that capture customer behavior and improve model performance.
- Machine Learning Project – Selecting algorithms, training models, evaluating performance, and optimizing predictions.
- Business Implementation Project – Deploying the model into production and integrating predictions into business workflows, such as CRM systems or marketing campaigns.
- Results Assessment Project – Monitoring model performance, measuring business impact, validating assumptions, and continuously improving the solution.
Build a standardized Advanced Analytics Data Model that is tailored to your business.
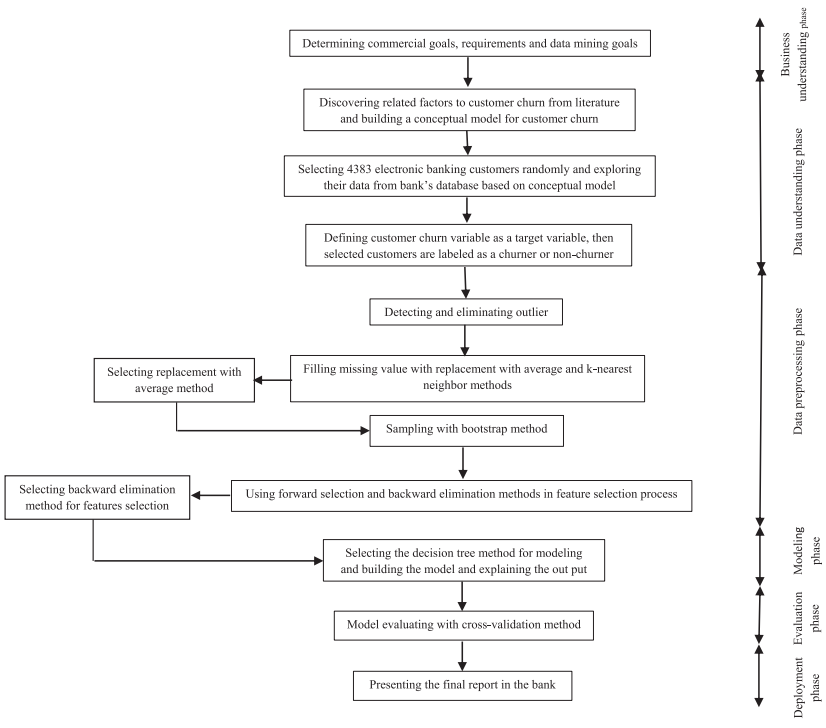
Prepare Workflow Phase
Modeling & Interpretation Phase
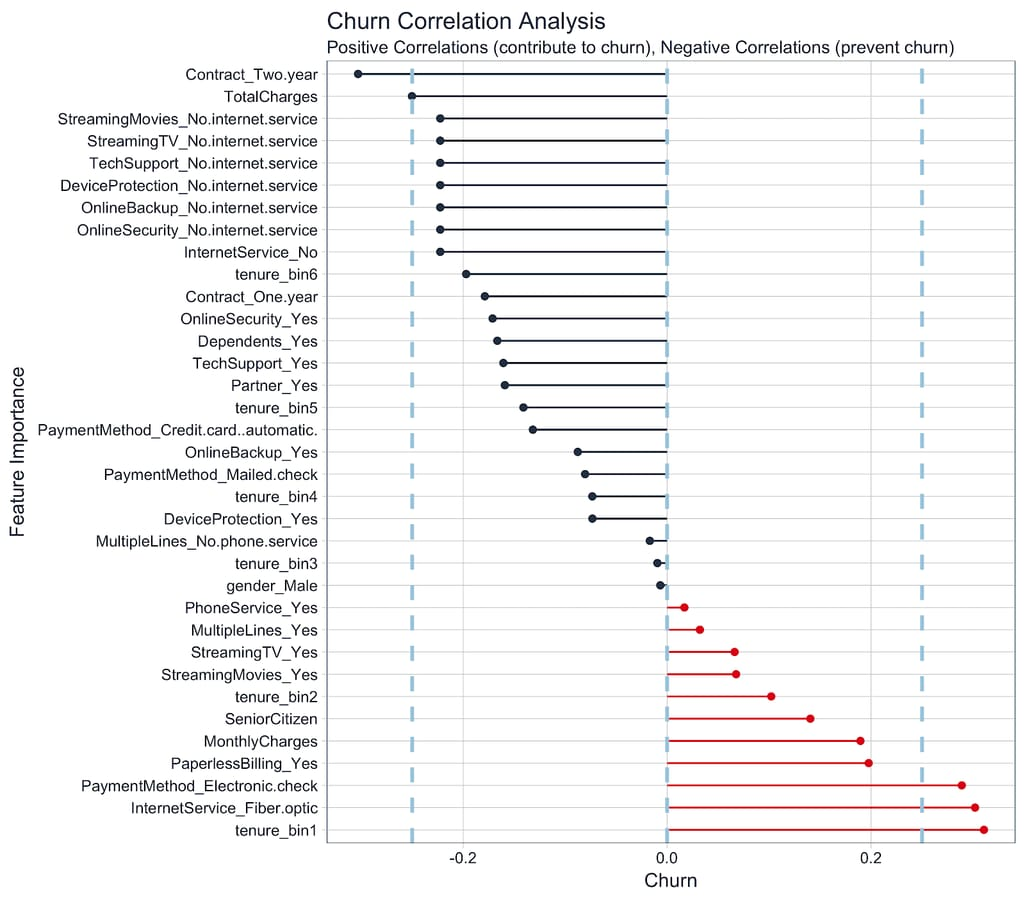
Modeling aims to capture the relationship between customer behavior and churn. Most machine learning algorithms are fundamentally curve-fitting method at the EOD by learn relationship from historical data.
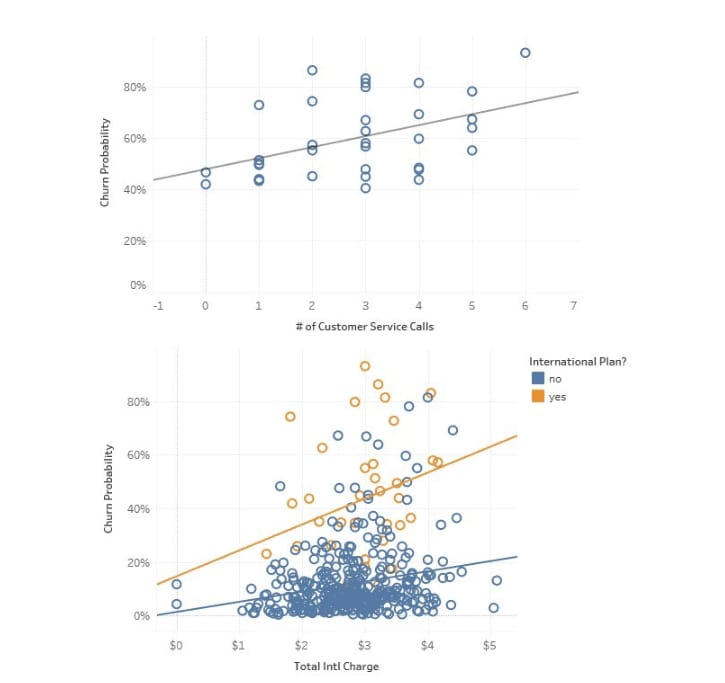
But What matters is the Actionable insights irrespective of ±0.0?? loss.
Principles of Effective Metrics
- Measure what matters. Focus on a small set of meaningful metrics that drive decisions rather than tracking everything.
- Connect metrics to people. Metrics should be traceable to individual customers so that quantitative insights can be validated through real customer feedback.
- Measure business outcomes. Prioritize metrics that reflect business success, such as revenue, retention, or customer satisfaction, instead of intermediate metrics like clicks or page views.
Evalution of Model
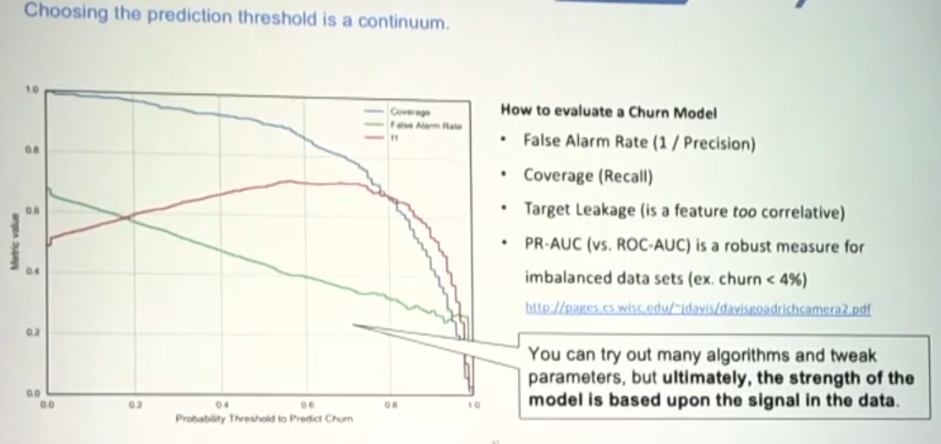
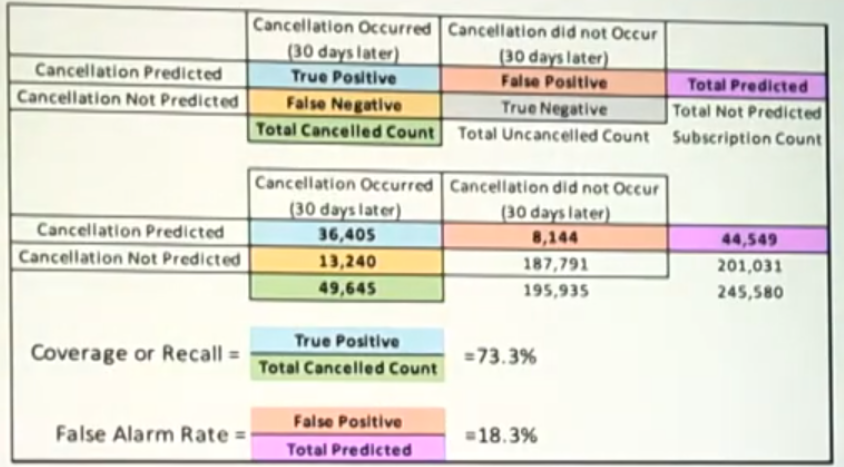
Evalution is crucial not only for audit purpose. To understand how it behaves to End Users
| principle | Strategy | Description | Example |
|---|---|---|---|
| Listen continuously | Talk to Your Customers | Collect regular feedback to understand customer needs and pain points before they leave. | Send customer satisfaction surveys, provide in-app feedback forms, or use live chat to gather suggestions. |
| Fix root causes | Know Your Weaknesses | Identify product or service shortcomings and continuously improve them. | A SaaS company discovers users struggle with onboarding and redesigns the onboarding experience. |
| Position yourself | Focus on Your Competitive Advantage | Reinforce the unique value your product offers compared to competitors. | An online storage service reminds customers about its secure backup and cross-device synchronization features. |
| Learn from cancellations | Understand Why Customers Cancel | Capture cancellation reasons and analyze common patterns to reduce future churn. | Add an exit survey asking, “Why are you leaving?” with options like “Too expensive” or “Missing features.” |
| Educate customers | Improve Customer Education | Help customers realize the full value of your product through proactive guidance. | Send tutorial emails, onboarding videos, or feature walkthroughs after signup. |
| Reinforce value | Reassure Customers of Your Product’s Value | Regularly remind customers about new features and benefits so they don’t overlook your product’s value. | Include new feature announcements and success stories in newsletters or support responses. |
Engineering Specfication
Tools used
Inside Customer-Churn-Prediction Project:






Dataset Scope
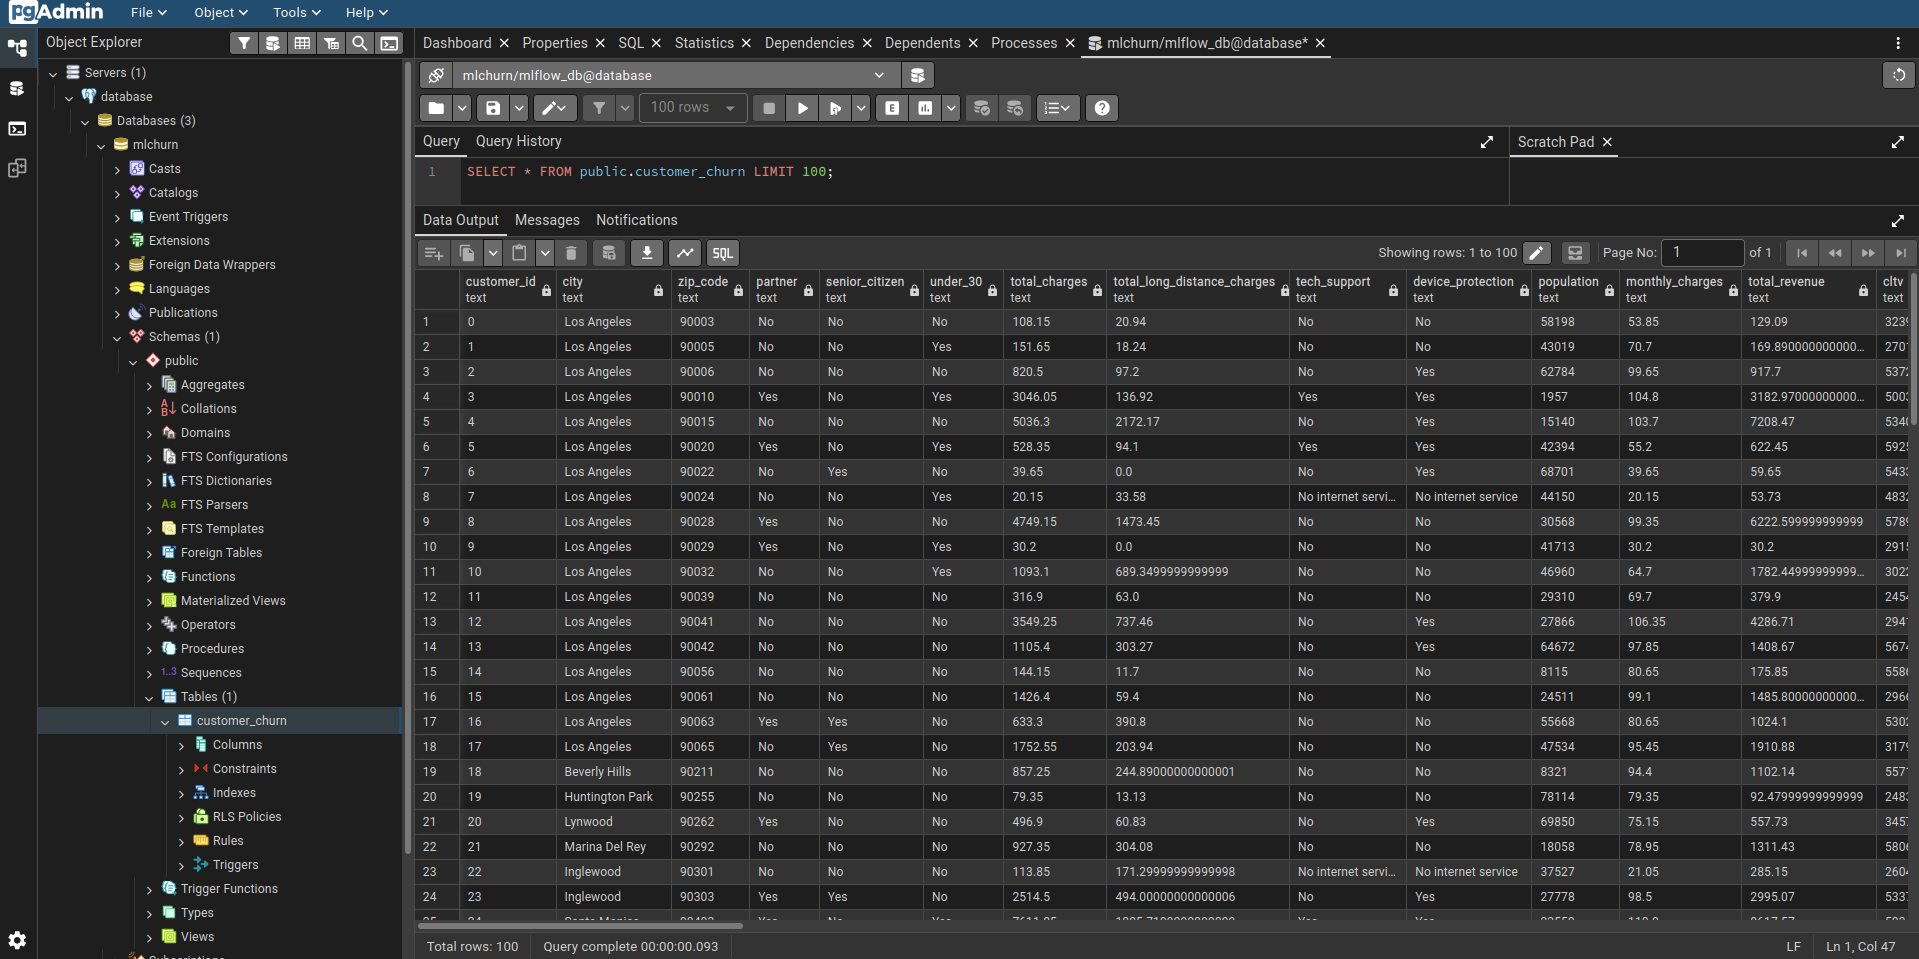
The project uses a telecommunications churn dataset assembled from several IBM-provided extracts — demographics, location, population, services, and account status — merged into a single customer_churn table. Rather than working off flat CSVs sitting in a repo, the data is loaded into PostgreSQL and versioned from there, which sets the tone for the rest of the project: nothing is treated as a one-off script.
MLOps Life Cyle
MLOps supports every stage of the ML lifecycle—from data ingestion, feature engineering, model training, deployment, and inferencing to monitoring.
This project builds an end-to-end Telecom Churn Prediction pipeline using DVC, Hydra, Optuna, MLflow, Docker, PostgreSQL, Prometheus, and Grafana for reproducibility, experiment tracking, deployment, and observability.
The primary objective is to show how modern MLOps tools work together to create a reproducible, scalable, and maintainable machine learning pipeline on local setup using Docker compose.
flowchart TD

subgraph group_data["Data lifecycle"]
  node_raw["Raw Excel files<br/>source data<br/>[.gitkeep]"]
  node_prep["Ingestion preparation<br/>Python script"]
  node_postgres_init["Postgres initialization<br/>database bootstrap<br/>[init-db.sh]"]
  node_postgres[("Customer churn table<br/>PostgreSQL")]
  node_dvc["Versioned CSV export<br/>DVC artifact"]
end

subgraph group_ml["ML workflows"]
  node_train_config["Hydra train composition<br/>configuration<br/>[train.yaml]"]
  node_model_configs["Model variants<br/>Hydra model configs<br/>[default.yaml]"]
  node_training["Model training<br/>Python entry point<br/>[train.py]"]
  node_hparams_config["Tuning settings<br/>Hydra configuration<br/>[hparams.yaml]"]
  node_search_spaces["Model search spaces<br/>Optuna configs"]
  node_tuning["Hyperparameter tuning<br/>Python entry point<br/>[hparams.py]"]
end

subgraph group_runtime["Local runtime"]
  node_mlflow[("MLflow tracking<br/>experiment tracking")]
  node_minio[("MinIO artifact storage<br/>S3-compatible storage")]
  node_compose["Docker Compose<br/>local orchestrator<br/>[compose.local.yaml]"]
  node_prometheus["Prometheus<br/>metrics collection<br/>[prometheus.yaml]"]
  node_grafana["Grafana<br/>metrics visualization"]
  node_app_environment["Python application environment<br/>runtime definition<br/>[pyproject.toml]"]
end

node_raw -->|"prepare"| node_prep
node_prep -->|"produces ingestion-ready data"| node_postgres_init
node_postgres_init -->|"loads"| node_postgres
node_postgres -->|"DVC import/export"| node_dvc
node_train_config -->|"selects"| node_model_configs
node_train_config -->|"composes runtime config"| node_training
node_model_configs -->|"configures classifier"| node_training
node_dvc -->|"dataset input"| node_training
node_training -->|"logs runs and models"| node_mlflow
node_hparams_config -->|"controls trials"| node_tuning
node_search_spaces -->|"defines candidates"| node_tuning
node_model_configs -->|"tunes model family"| node_tuning
node_dvc -->|"dataset input"| node_tuning
node_tuning -->|"logs tuning runs"| node_mlflow
node_mlflow -->|"stores artifacts"| node_minio
node_compose -->|"starts service"| node_postgres
node_compose -->|"starts service"| node_mlflow
node_compose -->|"starts service"| node_minio
node_compose -->|"starts service"| node_prometheus
node_compose -->|"starts service"| node_grafana
node_prometheus -->|"metrics source"| node_grafana
node_app_environment -.->|"provides dependencies"| node_training
node_app_environment -.->|"provides dependencies"| node_tuning

click node_raw "https://github.com/muthukamalan/customer-churn-prediction/blob/main/data/raw/.gitkeep"
click node_prep "https://github.com/muthukamalan/customer-churn-prediction/blob/main/scripts/prep_db_ingestion.py"
click node_postgres_init "https://github.com/muthukamalan/customer-churn-prediction/blob/main/postgres/init-db.sh"
click node_dvc "https://github.com/muthukamalan/customer-churn-prediction/blob/main/customer_churn.csv.dvc"
click node_train_config "https://github.com/muthukamalan/customer-churn-prediction/blob/main/configs/train.yaml"
click node_model_configs "https://github.com/muthukamalan/customer-churn-prediction/blob/main/configs/model/default.yaml"
click node_training "https://github.com/muthukamalan/customer-churn-prediction/blob/main/src/train/train.py"
click node_hparams_config "https://github.com/muthukamalan/customer-churn-prediction/blob/main/configs/hparams.yaml"
click node_search_spaces "https://github.com/muthukamalan/customer-churn-prediction/blob/main/configs/hparams/random_forest_hparam.yaml"
click node_tuning "https://github.com/muthukamalan/customer-churn-prediction/blob/main/src/hparams/hparams.py"
click node_compose "https://github.com/muthukamalan/customer-churn-prediction/blob/main/compose.local.yaml"
click node_prometheus "https://github.com/muthukamalan/customer-churn-prediction/blob/main/prometheus/prometheus.yaml"
click node_app_environment "https://github.com/muthukamalan/customer-churn-prediction/blob/main/pyproject.toml"

classDef toneNeutral fill:#f8fafc,stroke:#334155,stroke-width:1.5px,color:#0f172a
classDef toneBlue fill:#dbeafe,stroke:#2563eb,stroke-width:1.5px,color:#172554
classDef toneAmber fill:#fef3c7,stroke:#d97706,stroke-width:1.5px,color:#78350f
classDef toneMint fill:#dcfce7,stroke:#16a34a,stroke-width:1.5px,color:#14532d
classDef toneRose fill:#ffe4e6,stroke:#e11d48,stroke-width:1.5px,color:#881337
classDef toneIndigo fill:#e0e7ff,stroke:#4f46e5,stroke-width:1.5px,color:#312e81
classDef toneTeal fill:#ccfbf1,stroke:#0f766e,stroke-width:1.5px,color:#134e4a
class node_raw,node_prep,node_postgres_init,node_postgres,node_dvc toneBlue
class node_train_config,node_model_configs,node_training,node_hparams_config,node_search_spaces,node_tuning toneAmber
class node_mlflow,node_minio,node_compose,node_prometheus,node_grafana,node_app_environment toneMint
Data versioning that respects a database
Instead of the usual “commit a CSV” approach, this project pulls data straight out of Postgres using DVC’s database import feature:
dvc init
dvc config core.autostage true
dvc config core.analytics false

# [dvc-doc](https://doc.dvc.org/command-reference/import-db#database-connections)
# dvc config db.pgsql.url postgresql://user@hostname:port/database
# dvc config --local db.pgsql.password password

dvc config db.pgsql.url "postgresql://mlflow_db:mlflow_db@localhost:5432/mlchurn"
dvc config --local db.pgsql.password mlflow_db

# [dvc-doc](https://doc.dvc.org/command-reference/import-db#installing-database-drivers)
# dvc import-db --table customers_table --conn pgsql

dvc import-db --table "customer_churn" --conn pgsql # import from table to CSV (local) md5 hash
This is a nice pattern worth stealing: dvc import-db snapshots a table into a local, hashed CSV (tracked via a .dvc file), so every training run can point at an exact, reproducible version of the data — even though the source of truth lives in a live database, not a static file. The raw Excel extracts get prepared and normalized by scripts/prep_db_ingestion.py, which writes into data/processed/ before the table gets seeded into Postgres.
One Compose file, one command
The entire environment — Postgres, MLflow, MinIO (as the artifact store), Prometheus, and Grafana — comes up with:
docker compose -f compose.local.yaml up -d
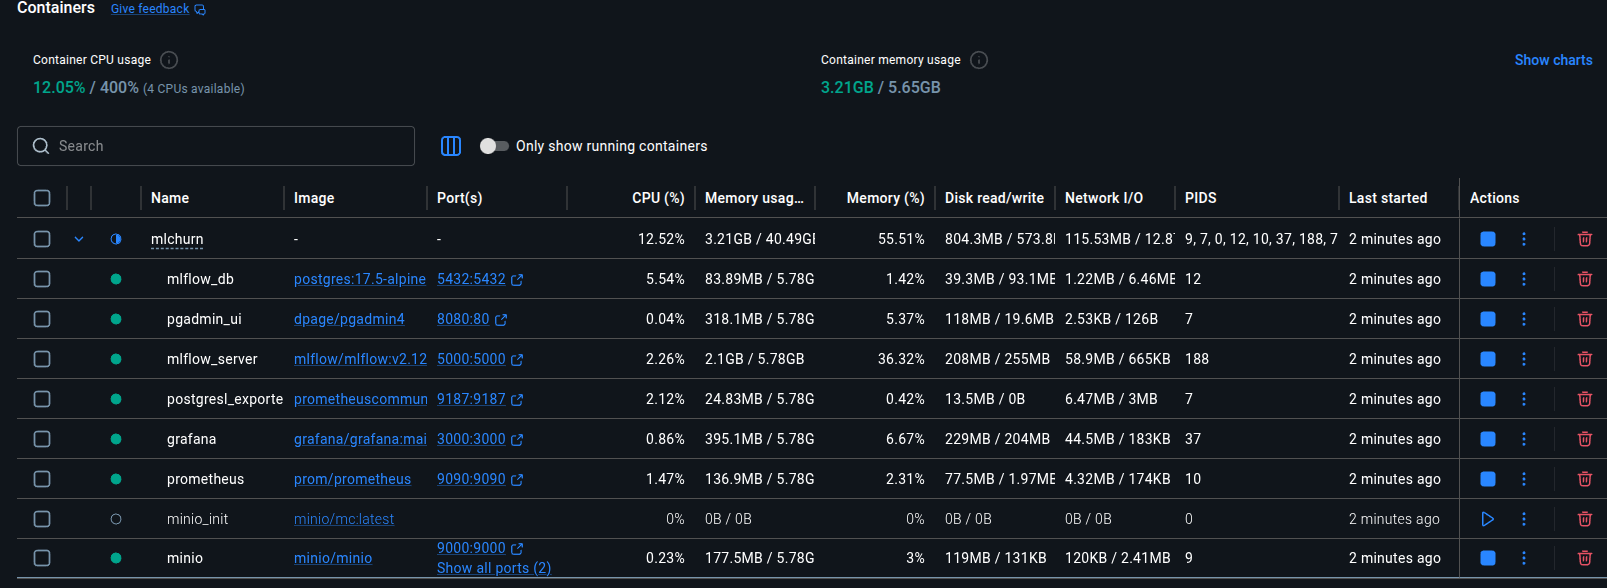
Service discovery between containers is handled entirely inside Compose, so there’s no manual wiring of hostnames or ports between the training scripts and the tracking/storage backends. This is the detail that makes the rest of the project actually reproducible on someone else’s machine: clone the repo, run one command, and the scaffolding for experiment tracking and monitoring already exists.
Hyperparameter search: Hydra config groups + Optuna sweeper
The hyperparameter search is config-driven rather than hardcoded. A search space is declared in YAML:
# configs/hparams/decision_tree_hparam.yaml
params:
    model.max_depth: range(2, 20, 5)
    model.min_samples_split: range(0, 20, 1)
    model.min_samples_leaf: choice(1, 2, 4)

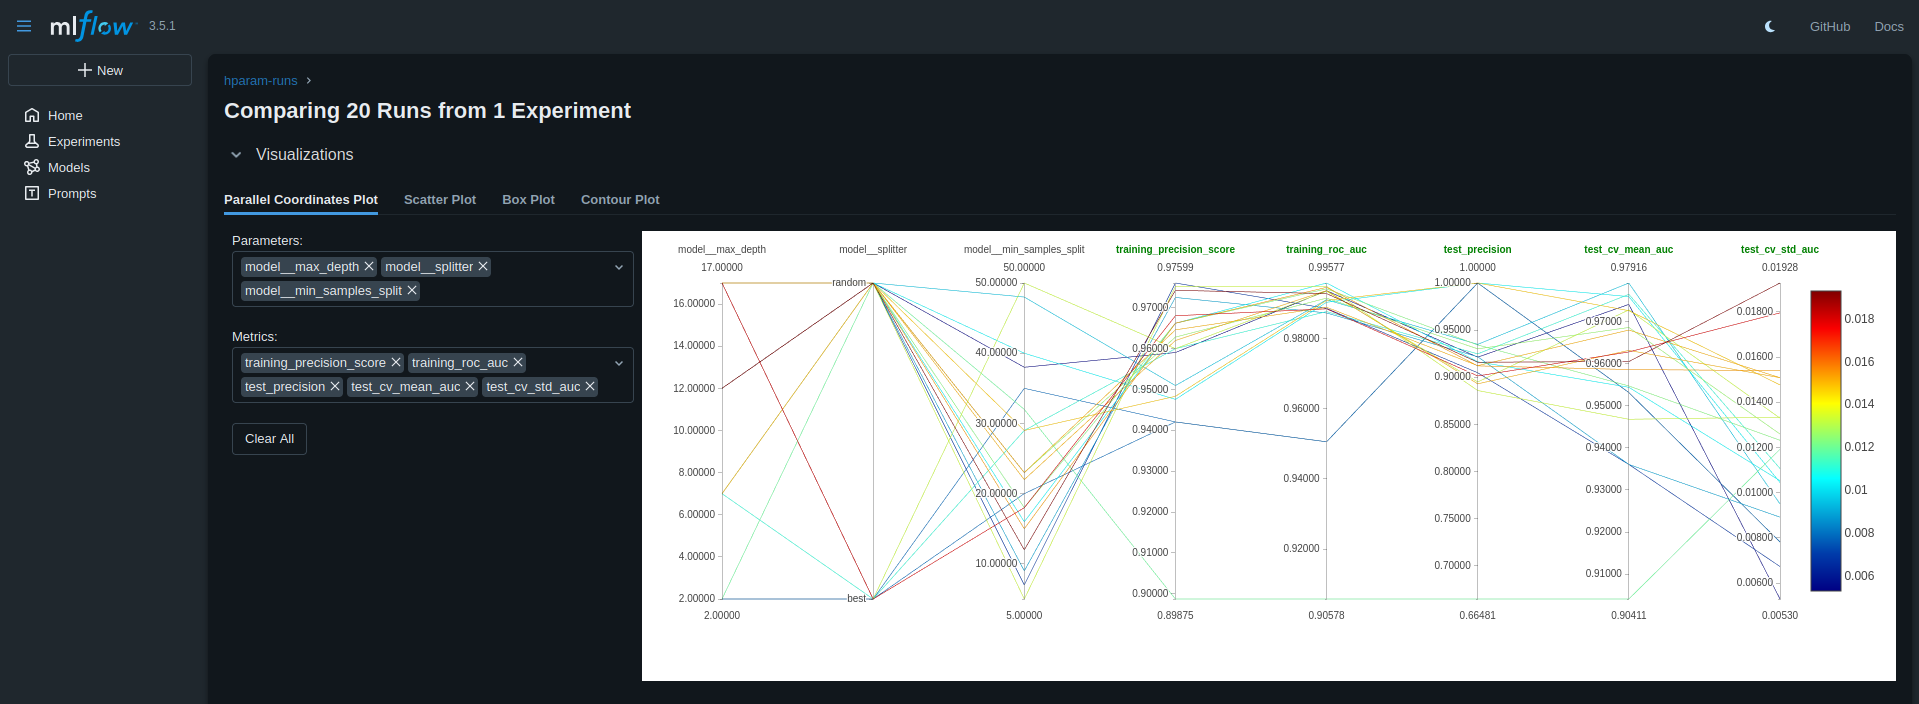
and launched as a Hydra multirun:
HYDRA_FULL_ERROR=1 python src/hparams/hparams.py -m hparams=decision_tree_hparam

- matplotlib.use("Agg") # Forces a headless, thread-safe backend
- optimizing for F1 Score
Under the hood, Hydra’s Optuna sweeper plugin drives the actual search — trial count, direction, and job concurrency are all config values (n_trials, direction: maximize, n_jobs), and the objective being maximized is F1 score, a sensible choice given churn datasets are typically imbalanced and precision/recall trade-offs matter more than raw accuracy. One practical gotcha the author flags: multirun sweeps need matplotlib.use("Agg") forced explicitly, since the default backend isn’t thread-safe when Optuna fires off concurrent trials.
Swapping hparams=decision_tree_hparam for another config file is enough to point the same search machinery at a different model family — the project currently supports:
- Logistic Regression
- Decision Tree
- Gradient Boosting
- K-Nearest Neighbors
- Random Forest
with broader scikit-learn model coverage listed as a TODO.
Training and artifact tracking
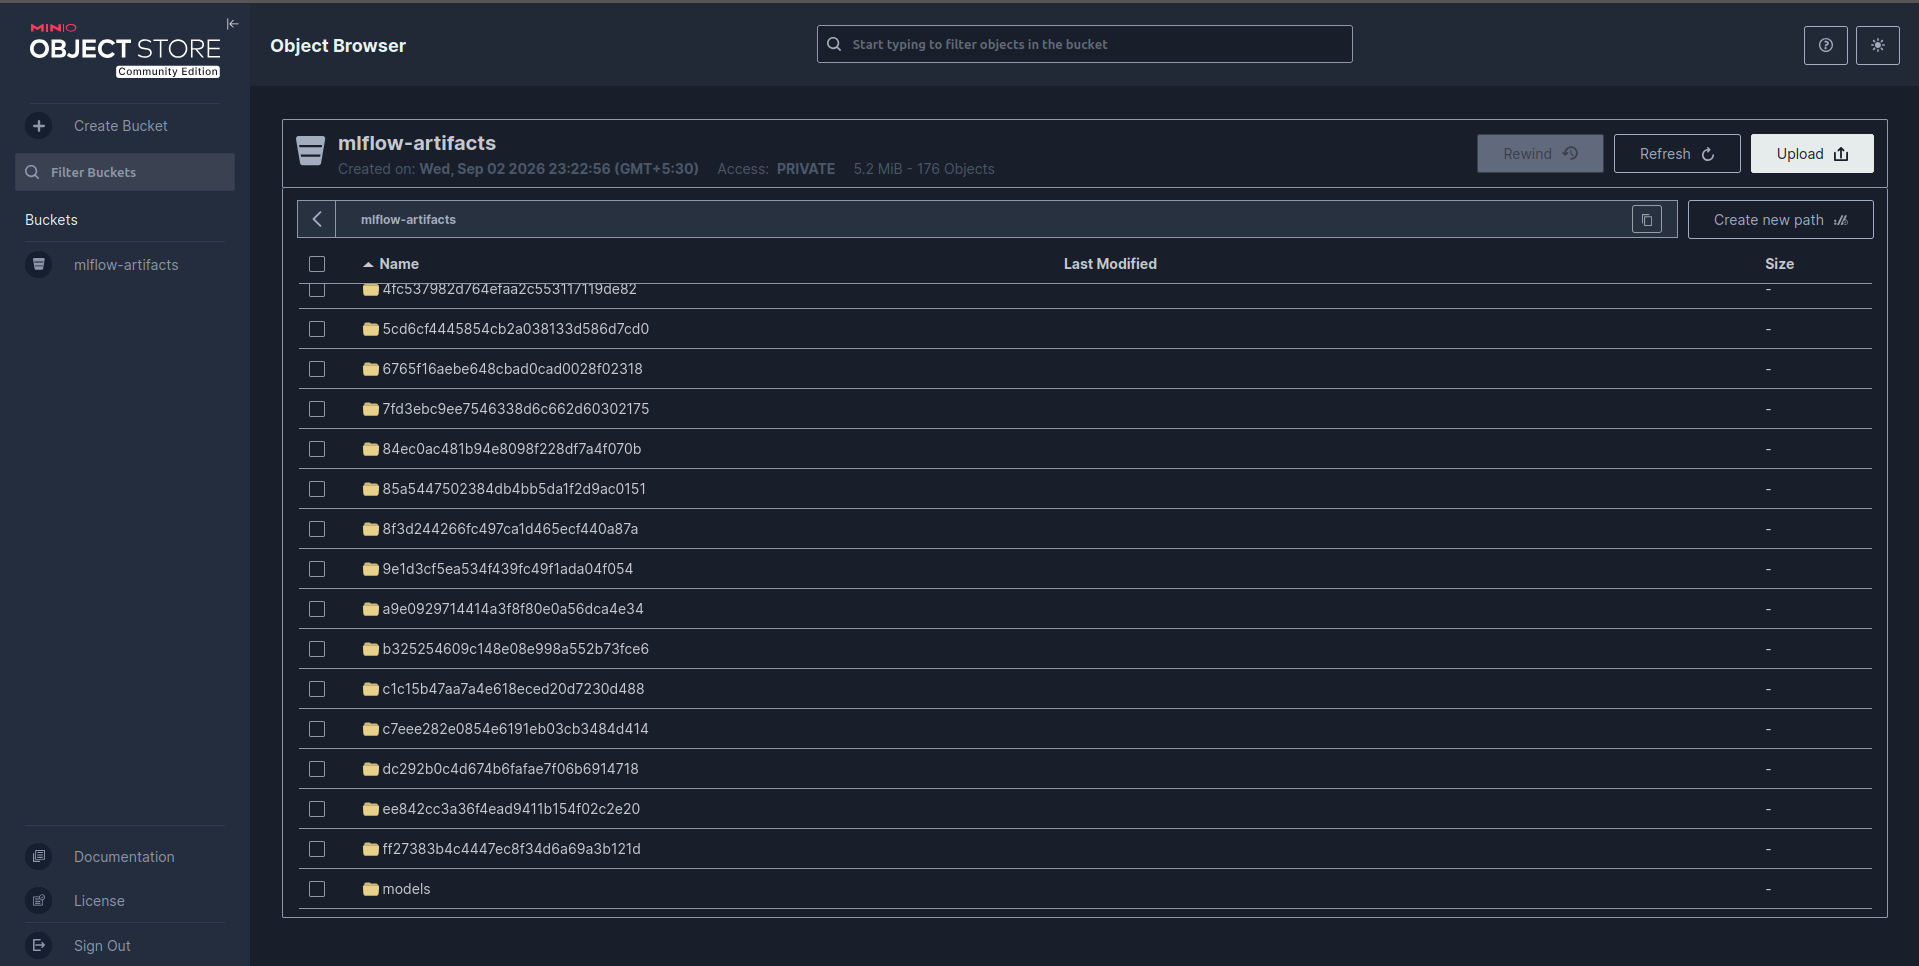
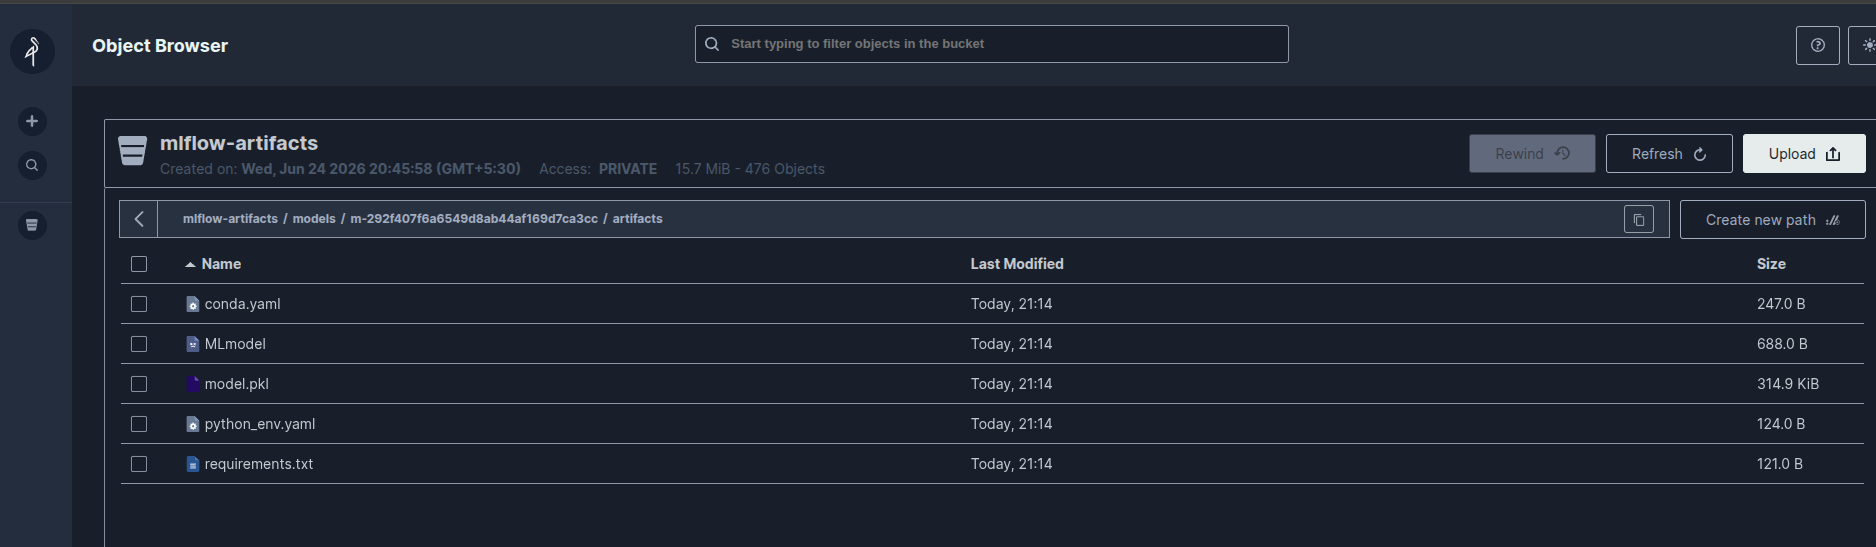
Once a search has identified good hyperparameters, a full training run is a single Hydra-composed command:
HYDRA_FULL_ERROR=1 python src/train/train.py mlflow.run_name=rf_best_model model=random_forest

Every run logs to MLflow, and every trained model artifact lands in the MinIO container rather than on local disk — meaning experiment metadata and the actual serialized models are both centrally accessible, which matters the moment more than one person (or more than one machine) touches the project.
Observability from day one
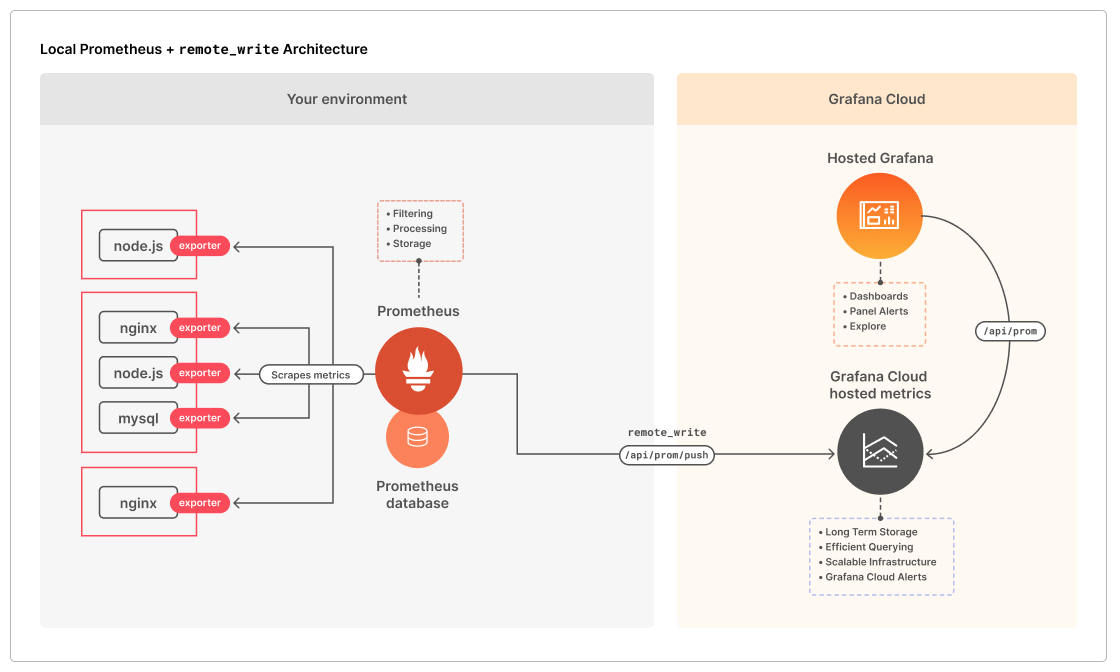
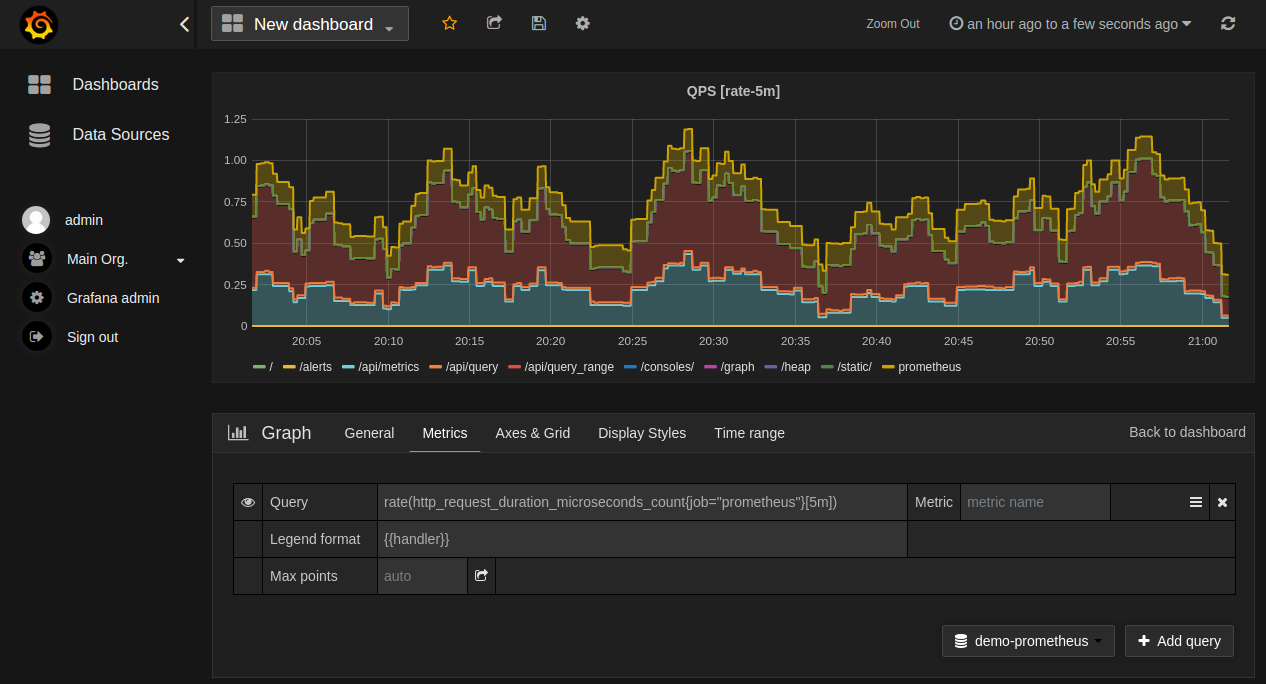
Most churn-prediction side projects stop at “does the model score well.” This one ships Prometheus and Grafana as first-class Compose services from the start, which signals a bias toward treating the model as something that will eventually run as a service and need monitoring — not just a notebook artifact that gets screenshotted into a slide deck.
Why this project is a good MLOps reference
What makes this repo worth reading isn’t the model choice — decision trees and random forests on churn data are well-trodden ground. It’s the plumbing:
- DVC +
import-dbfor reproducible database-backed datasets, not just file-backed ones. - Hydra config groups that turn “try a different model” into a one-line CLI override instead of a code change.
- Optuna via Hydra’s sweeper plugin for hyperparameter search that’s declarative and resumable.
- MLflow + MinIO for tracking and artifact storage that survive container restarts.
- Prometheus + Grafana wired in from the start, not bolted on after a production incident.
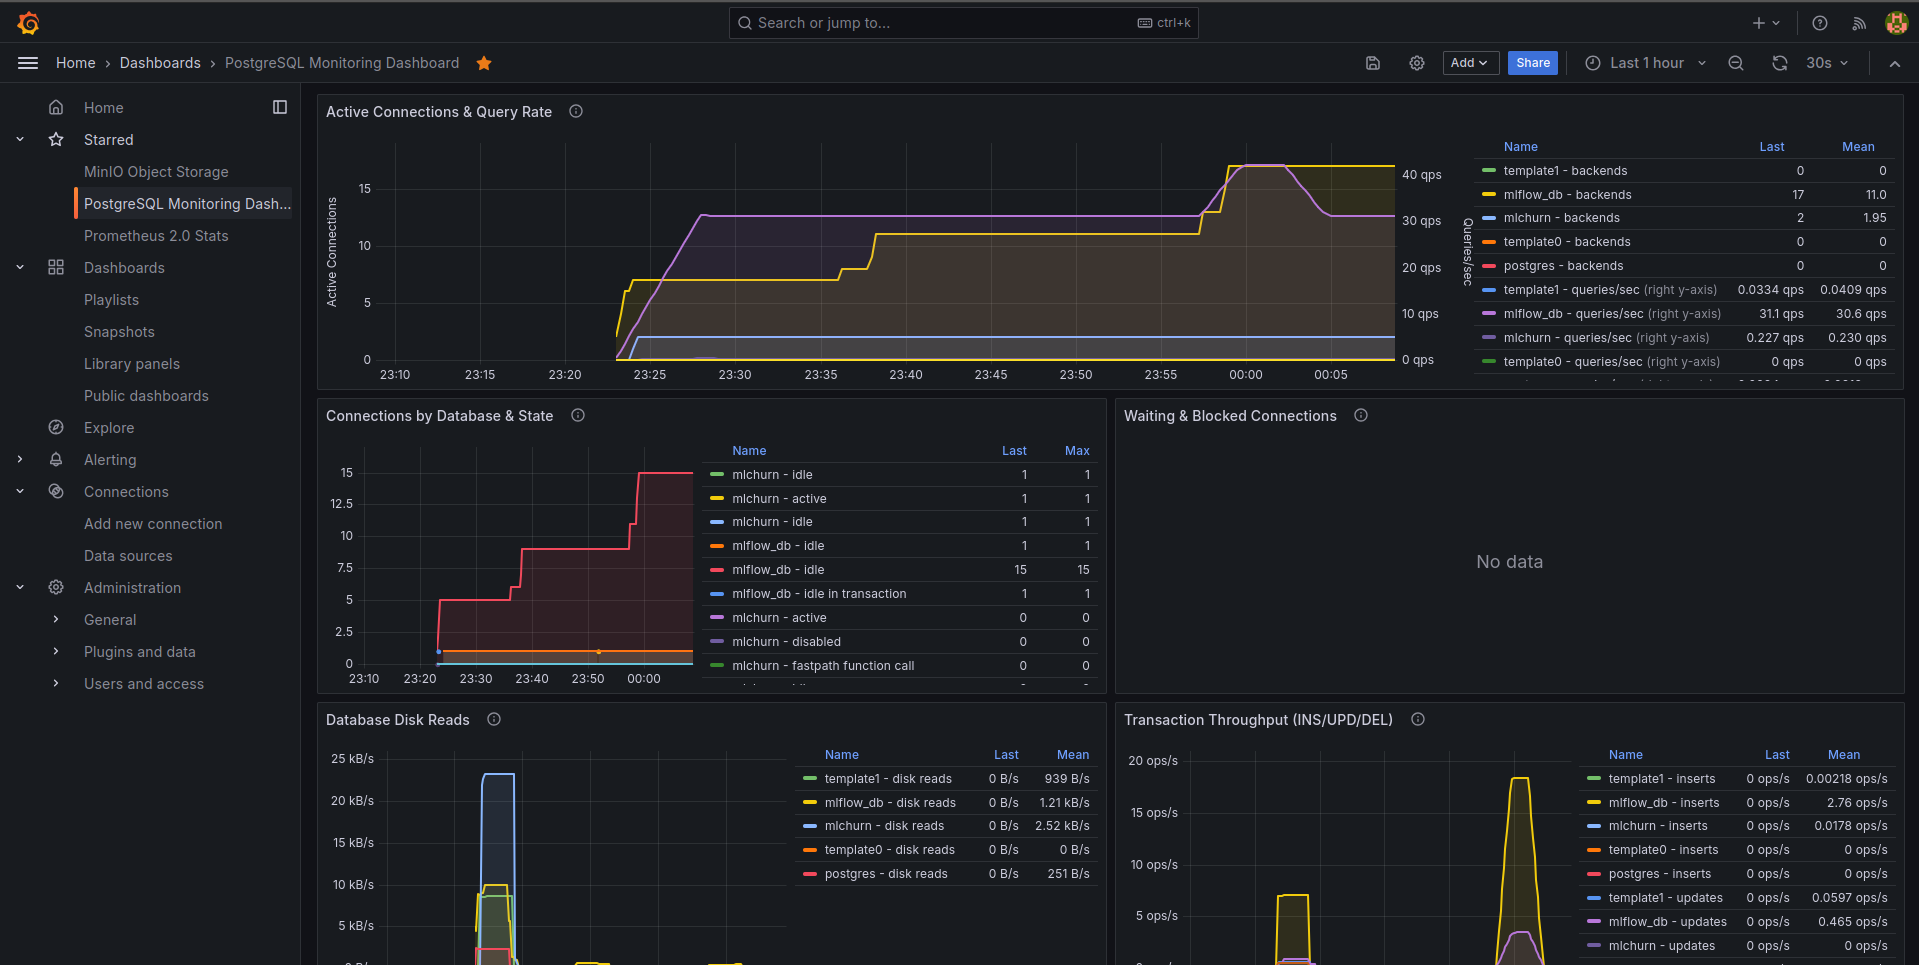
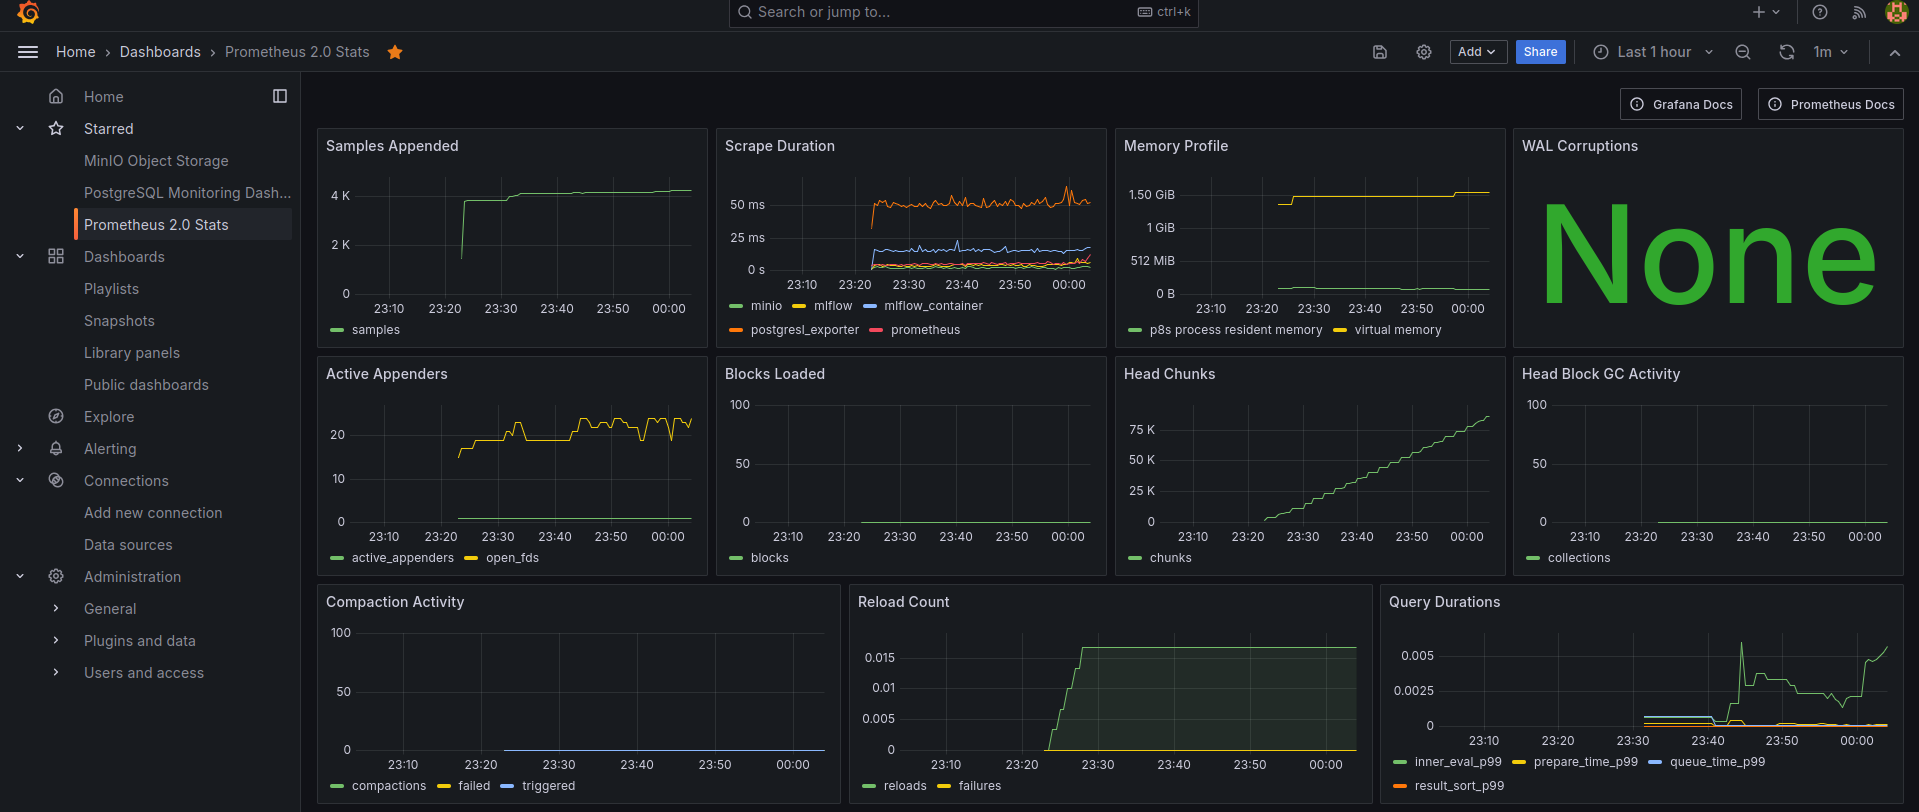
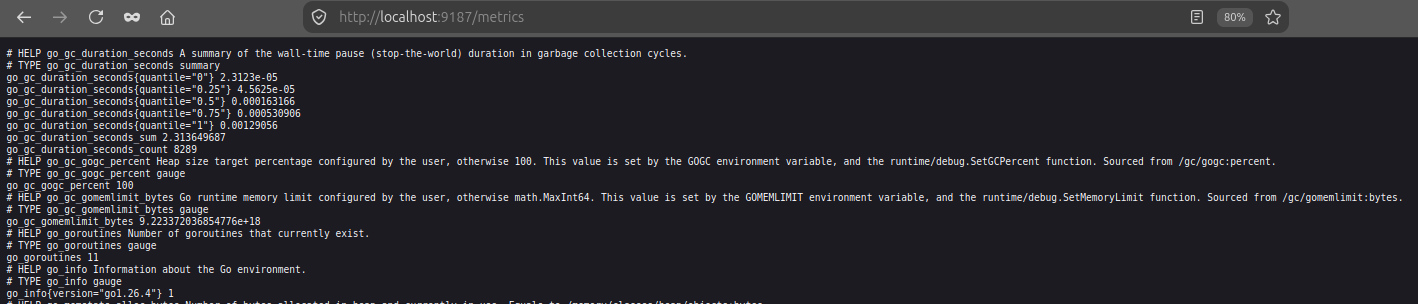
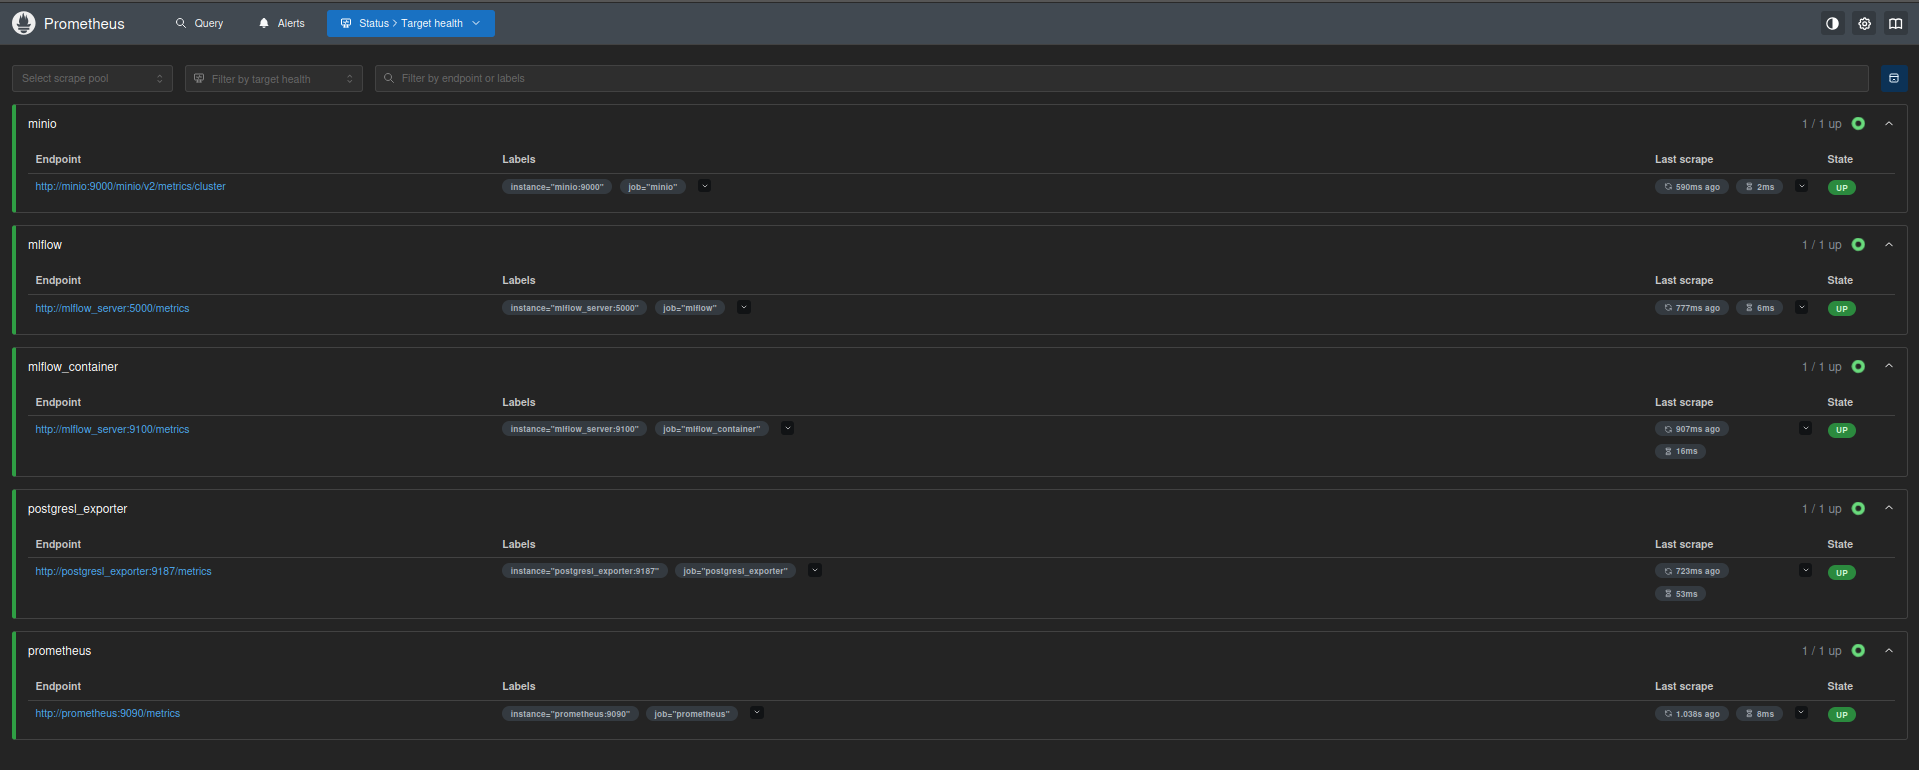
For anyone setting up a similar pipeline, the pattern worth copying is the layering: data versioning, config-driven search, experiment tracking, and monitoring are each handled by a purpose-built tool, glued together with Hydra configs and a single Compose file rather than custom orchestration code.

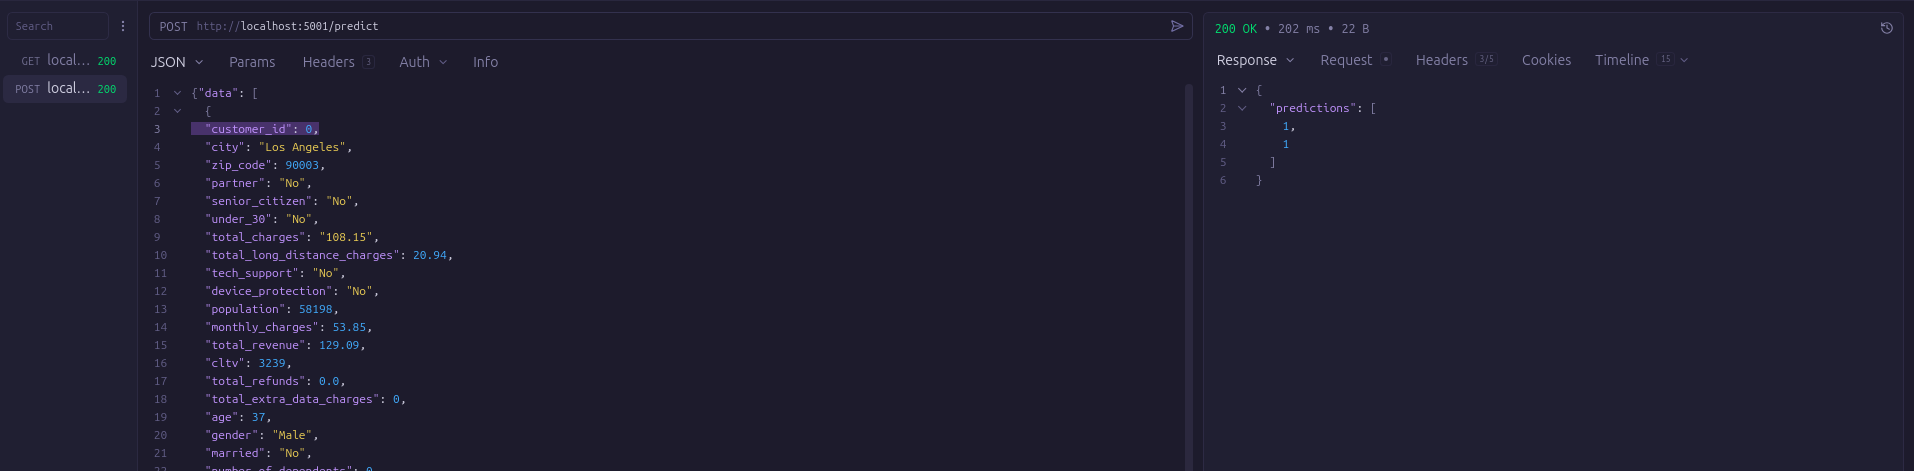
Gist from experiences:
- If you keenly following your problem then get to know how to do things like run email and call campaigns, create churn save playbooks and designing pricing and packaging in your org. Don’t think SILOS
Gist
1. Core Definitions
Churn — when a customer quits using a service or cancels their subscription.
\[\text{churn_rate} = \frac{\text{churned_customers}}{\text{start_customers}}\]Customer retention — the opposite of churn: keeping customers active and renewing.
\[\text{retention_rate} = \frac{\text{retained_customers}}{\text{start_customers}}\]💡 Price reduction is a “diamond bullet” against churn — it always works, but you can’t afford it. There is no cheap, reliable “silver bullet” to reduce churn.
💡 A one-size-fits-all churn intervention doesn’t exist, so predicting who will churn is only marginally useful for reducing churn on its own. Focus effort on understanding the data and designing good metrics (feature engineering) rather than obsessing over algorithms.
The typical subscription scenario
- A product/service is used on a recurring basis.
- Customers interact with the product; subscriptions may cost money.
- Ending a subscription (or, without subscriptions, ceasing to use the product) = churn.
- Transactional DB → timing/prices/payments. Data warehouse → usage/interaction events.
2. Measuring Churn
People-centric roles:
| Role | Meaning |
|---|---|
| Subscriber | Has a subscription (tied to MRR) |
| Customer | Pays |
| User | Neither pays nor subscribes |
MRR (Monthly Recurring Revenue) — recurring revenue tied to paid subscriptions.
Payment types:
- Recurring — fixed amount, fixed period
- Usage-based — pay per unit consumed
- One-time — setup fees, temporary upgrades, in-app purchases
Product types: B2C, D2C, B2B (SaaS)
Business/Revenue models: ad-supported media, consumer feed subscriptions, freemium, in-app purchases
Common prediction use cases (all driven by customer behavior data):
- Inactivity → churn signal
- Free trial → conversion
- Upsell / downsell
- Binary yes/no churn prediction
- General customer activity prediction
Key metric types:
- Utilization — % of allowed service usage consumed
- Success — how well the user achieves their desired outcome
- Unit cost — price relative to quantity consumed
3. Measuring Customers
- Event — a fact about user behavior, stored with a timestamp in the data warehouse.
- Metric — a summary measurement of behavior over time (also timestamped).
- Active period — if an account isn’t in an active period, the end of its last active period marks a churn.
Behavioral metrics summarize each customer’s events at one point in time or across many (weekly/monthly rollups are common).
4. Observing Renewal & Churn
- Dataset — a concise table of facts + outcomes for the situations you want to analyze (one row per situation, consistent columns, complete info).
- Churn analysis dataset — a table of behavioral snapshots covering both churned and non-churned customers.
💡 It’s easier to convince customers to stay before they churn than to win them back after.
💡 The goal of analysis is to find customers still “making up their minds” about churning — that’s when you have the best chance to influence them.
5. Understanding Behavior via Metrics — Cohort Analysis
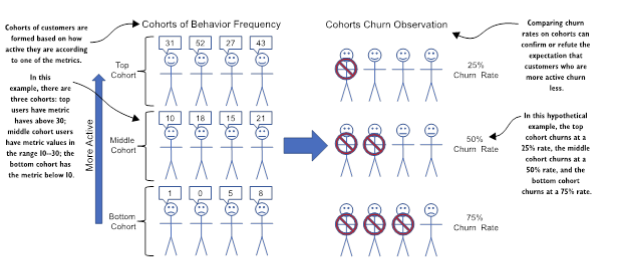
Look for behavioral metrics with a strong relationship to churn — a good one is usually obvious once you see the results (no heavy stats needed).
- Cohort — a group of individuals similar on a particular metric (within a small range).
- Metric cohort — cohort defined by similar values on one metric.
- Cohort analysis — comparing different cohorts on another measurement/metric.
- Churn cohort analysis — comparing churn rates across metric cohorts.
⚠️ Correlation vs. causation: use business knowledge to judge whether a metric causes churn/retention or is merely associated with it. A metric is more likely causal if it’s closely tied to the customer’s actual usefulness/enjoyment of the product.
Customer profiling — clustering algorithms automatically group similar customers based on data.
6. Advanced Metrics
Customer Lifetime Value (CLV) — total expected worth of a customer (revenue minus costs) over their full lifetime; a forward-looking forecast.
Customer Acquisition Cost (CAC) — total marketing/sales spend per customer acquired (varies by channel/campaign).
Cost of Goods Sold (COGS) — ongoing cost to serve existing customers (cloud infra, support, etc.), can vary by customer type.
\[\text{CLV}_{\text{acquisition}} = -CAC + \sum_{t=1}^{T} (RR_t - COGS_t)\]💡 Regression works best with uncorrelated or moderately correlated metrics — avoid feeding highly correlated metrics into a regression model.
7. Evaluating Model Accuracy
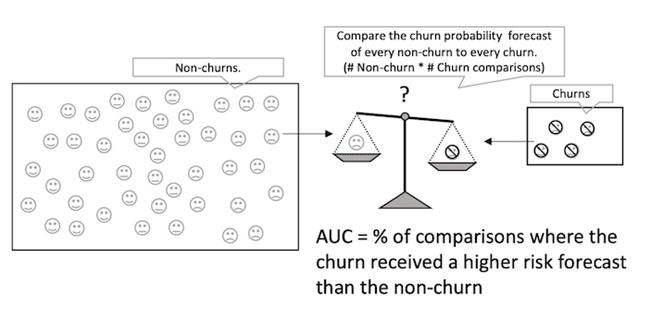
AUC (Area Under Curve)
Pairwise test: pick one churned + one non-churned customer. Success = model scores the churner higher. AUC = % of all such pairwise comparisons where the model got it right.
| AUC | Diagnosis |
|---|---|
| < 0.45 | Something’s wrong — model predicting backwards (check predict_proba column / data) |
| 0.45 – 0.55 | Random guessing — check your data |
| 0.55 – 0.6 | Slightly better than random — improve data/metrics |
| 0.6 – 0.7 | Healthy: weakly predictable churn |
| 0.7 – 0.8 | Healthy: highly predictable churn |
| 0.8 – 0.85 | Extremely predictable — suspicious for consumer products; more plausible for B2B |
| > 0.85 | Probably a bug — churn is rarely this predictable |
Lift (specifically: Top Decile Lift)
Lift — relative increase in response rate due to some “treatment” vs. baseline (lift of 1.0 = no improvement). Best suited for measuring improvement on rare events.
Top decile lift — ratio of churn rate in the top 10% riskiest-predicted customers to the overall churn rate. Baseline = overall churn rate (what you’d get by guessing randomly). When people say “lift” in churn contexts, they usually mean this.
| Low Churn (<10%) | High Churn (>10%) | Diagnosis |
|---|---|---|
| < 0.8 | < 0.8 | Something’s wrong — predicting backwards |
| 0.8 – 1.5 | 0.8 – 1.2 | Random guessing |
| 1.5 – 2.0 | 1.2 – 1.5 | Better than random, but not good |
| 2.0 – 3.5 | 1.5 – 2.25 | Healthy: weakly predictable |
| 3.5 – 5.0 | 2.25 – 3.0 | Healthy: highly predictable |
| 5.0 – 6.0 | 3.0 – 3.5 | Extremely predictable — suspicious unless B2B |
| > 6.0 | > 3.5 | Probably a bug |
8. Modeling Notes
- Machine learning model — fit from data (not hand-programmed), distinct from a plain regression model.
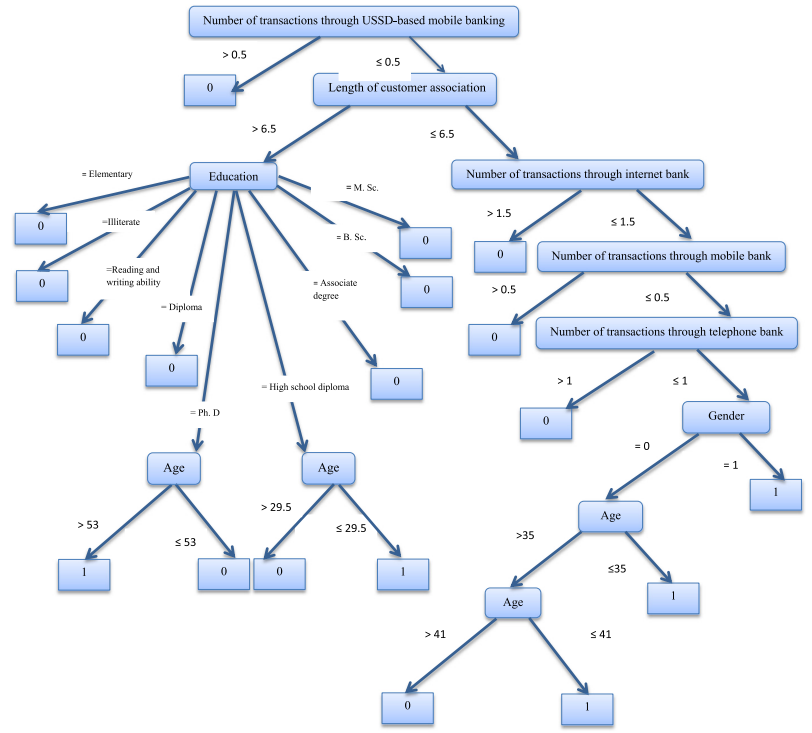
- Decision tree — simple model, forecasts via a tree of metric comparison rules.
- XGBoost — ensemble of decision trees with weighted predictions; generally beats regression on accuracy.
- Both XGBoost and regression benefit from advanced metrics (CLV, CAC, etc.) in addition to basic ones — tune XGBoost params via cross-validation.
- ⚠️ XGBoost churn probabilities are not calibrated to true churn rates — don’t use raw XGBoost outputs for CLV or anything requiring actual probability values.
9. Confidence Intervals on Churn Rate
- Expected value — the measured churn rate on past customers; treated as the most likely value for the true (universe) churn rate.
- Upper confidence interval — range from expected churn to worst-case estimate (size = worst case − expected).
- Lower confidence interval — range from best-case estimate to expected churn (size = expected − best case).